
How We Calculate CLV at OVAS™ (And Turn It Into a 300% ROI guarantee)
- Team OVɅS™
- Apr 7
- 5 min read

In this article, we break down exactly how we calculate CLV, how we turn it into actionable visitor targets, and how that translates into your 300% ROI guarantee.
Let’s get right into it.
TL;DR
We calculate your CLV → turn it into average visitor value → define how many visitors you need. Your profit is locked in upfront. We operate within a margin and take the execution risk.
Customer Lifetime Value (CLV) can be calculated in multiple ways.
We start with numbers your business already trusts:
Your revenue data
Your customer behavior
Your conversion rates
We’re building a model that actually holds under pressure.
At its core, every business runs on one simple relationship:
How much a customer is worth
Vs
How much does it cost to acquire them

If the gap is small → growth becomes expensive and fragile.
If the gap is large → growth becomes scalable.
Here’s how we operate:
You always get the CLV return promised.
We take the risk of hitting the targets—profitably or unprofitably
Traffic, rankings, visibility—they’re just byproducts of our work.
So, let’s move on to the formulas we use.
The 3 CLV Models We Use
Different models give us slightly different numbers.
Running them together gives us a range we can trust.
If the client already knows their numbers, we double-check and plug them in.
#1: Behavioral CLV (Purchase-Based)
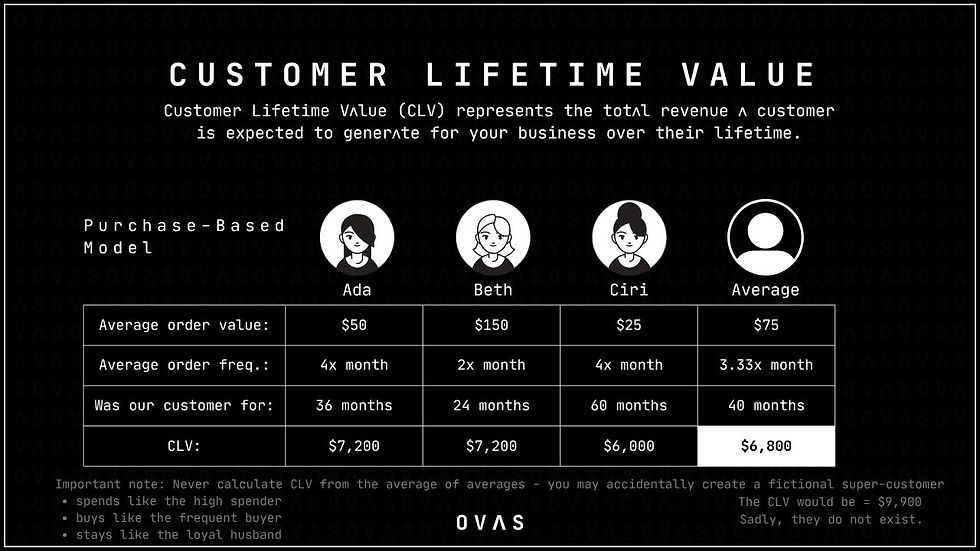
What it gives:
CLV based on actual buying behavior.
It measures the value of repeat customers in your business and reveals potential gaps in segmentation, retention or spend.
Formula:
Average spend × purchase frequency × lifespan.
#2: Subscription CLV (ARPA / Churn)

What it gives:
CLV based on retention dynamics.
It highlights whether your recurring customers are delivering the lifetime value expected and signals where business development may be needed.
Formula:
Average revenue per account ÷ churn rate.
#3: Industry Average CLV (Local Benchmark)
What it gives:
A benchmark for comparison purposes only.
It helps determine whether the client’s numbers and/or ours make sense, but we never use it to plan growth or traffic.
We compare key metrics against the client’s numbers to identify gaps or red flags.
Why this works
This shows whether your business is healthy enough to scale, highlights where optimization may be needed, and forms the foundation for translating CLV into average visitor value and guaranteed ROI.
Did you know?
Increasing customer retention by just 5 % can boost profits by 25 – 95 %. One of the most effective ways to do this is by providing customers with clear, actionable guidance on “how to use your product”.
Customers who receive educational and usage‑focused content after purchase show 20 – 30 % higher product adoption and retention compared to those who don’t.
That’s because education shortens time‑to‑value and reduces early frustration—keeping users engaged longer and increasing their lifetime value.
From CLV to Average Visitor Value
CLV was just the start.
Our scope calculations continue with your investment.
For example:
Investment amount: $10,000
Target return: 300%
Required CLV output: $40,000
This tells us exactly what each visitor is worth and how many we need to deliver your guaranteed return.
Translate to Customers
If CLV = $4,000, then for a $40,000 return, we need 10 customers
Apply Conversion Rates
Not every visitor buys. So we expect content conversion ranges:
Conservative: 0.1%
Realistic: 1%
Optimistic: 2%
From there, we calculate the number of visitors needed:
At 0.1% → 10,000 visitors
At 1% → 1,000 visitors
At 2% → 500 visitors
Derive Visitor Value
Visitor Value = CLV × Conversion Rate
$4,000 × 0.1% = $4 per visitor
$4,000 × 1% = $40 per visitor
$4,000 × 2% = $80 per visitor
This tells us exactly how much we can spend to acquire each visitor while protecting your CLV profit.
Example in practice:
By month three, the project delivered 2230 visitors. Two of them converted into clients, resulting in $8,000 in CLV from a $2,230 acquisition spend. Your margin is locked in, and our system operates within that efficiency to deliver the 300% ROI guarantee.
System Calibration Layer
Customer behavior changes. Inflation grows. Markets shift. Offers evolve.
So a one-time calculation is foolish.

Produce = create Visitor Acquisition Assets (VAAs) + distribution
Measure = track visitor flow, conversion, CLV impact
Pivot = adjust effort, asset strategy, distribution, messaging based on performance
What We Track
Demand vs Production – Are we producing what the market actually wants? Are we aligned, or are we pushing irrelevant assets?
Visitor Quality – Are visitors converting as expected, or is it useless traffic from irrelevant sources?
Average Order Value Changes – Are customers spending more, less, or as projected?
Customer Lifespan Shifts – Are customers sticking around longer, shorter, or the same?
Old vs Actual vs Projected CLV – How does reality compare to the model we based our targets on?
This tells us one thing:
Are we on track to hit the target… or not?
What Happens Next
If the system is overperforming → we throw a party but don’t sleep on success.
If the system is aligned → we keep it up.
If something drifts → we adjust.
That can mean:
Improving infographics
Researching trends
Refining CTAs
Reallocating effort across assets and distribution
Final Words
Most businesses try to win with better ads, better content, better tactics.
That’s a race to marginal gains.
We help you to compete on economics.
If your numbers allow you to acquire customers profitably at scale, you don’t need to outsmart competitors—you outlast them.
You can spend more.
You can move faster.
You can absorb hits they can’t survive.
Want To Compete On That Level?
We’ll go through your numbers and see what’s actually possible.
No pitch. Just math.
FAQ: What If…
Q: What if I don’t have the numbers?
A: We can still work with you—but only via an effort-based model (VAA + Distribution).
You pay per asset and distribution. Visitor flow will increase with our best practices, but we cannot track ROI to the last dollar.
Q: What if my CLV is low?
A: Low-ticket businesses have different dynamics. That doesn’t automatically rule you out. We’ll review your numbers on a call and see what’s realistic. Sometimes there’s an opportunity to increase CLV before scaling.
Q: What if I want to try it out?
A: No free trials here. Performance-based guarantees require real commitment from both sides. We do, however, share portfolio examples, and for certain cases, effort-pricing trials are available.
The best way forward? Let’s hop on a call and see what makes sense.
Disclaimer on CLV Modeling & Performance Guarantees
All Customer Lifetime Value (CLV) models and related calculations are inherently subject to limitations. They rely on historical data, assumptions, and estimates that may not fully reflect future performance due to changes in customer behavior, market conditions, pricing, competition, or other external factors beyond either party’s control.
The models presented serve as baseline frameworks for planning and decision-making. Where appropriate, more advanced methodologies may be applied, including customer segmentation and weighted value distribution across segments, based on available data and client-defined priorities.
All assumptions, inputs, and resulting outputs are reviewed and mutually agreed upon prior to execution. Once approved, these figures constitute the operational baseline and remain valid until the next scheduled calibration or a mutually agreed revision.
Where a performance guarantee is offered, it is strictly based on these agreed baseline metrics and the defined scope of work. The guarantee applies only under the condition that agreed inputs, conversion mechanisms, offer structures, and operational factors on the client’s side remain materially consistent throughout the engagement.
Projections and targets are intentionally set using conservative assumptions to create a margin of safety and increase the likelihood of overdelivery.
The guarantee reflects a shared economic model—not a blanket assurance against all external variables—and is enforceable only within the boundaries of the agreed framework and responsibilities of both parties.


Comments